Queens’ subway lines go from one extreme to the other, depending on where you’re riding.
The annual “State of the Subways Report Card” found that some lines running through the “World’s Borough” are ranked the best in terms of service, while others need to make major improvements.
The New York Public Interest Research Group (NYPIRG) collects train data every year to gauge the rider satisfaction of each line. Factors such as the amount of scheduled service, regularity of service, breakdown rate and cleanliness were accounted when ranking the 20 lines.
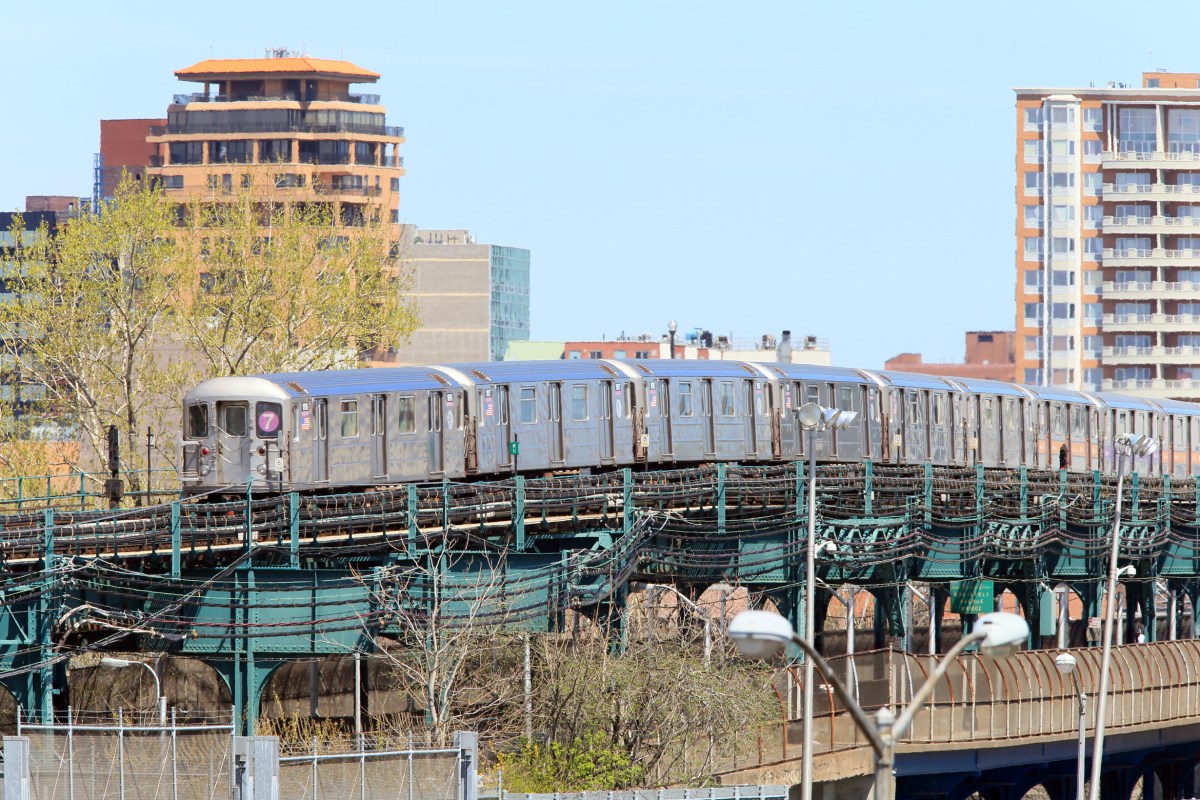
This year, three lines emerged as the best — the 1, 7 and L trains. The 7 runs through Queens, making stops in Flushing, Corona, Jackson Heights, Elmhurst, Sunnyside, Woodside and Long Island City. It ranked first in amount of scheduled service and cleanliness.
It ranked 12th in regularity of service, 10th in breakdown rate, 14th in crowding and 10th in accurate and frequent in-car announcements.
But the spotty service in Queens has caused headaches for borough commuters and has even lead to the creation of a Facebook page, 7 Train Blues, to document and complain about the line.
Unsurprisingly, the A train was considered the worst train line this year along with the 5 train. The A train runs through Manhattan, Brooklyn and the Queens neighborhoods of Ozone Park, Howard Beach and the Rockaways.
It ranked 10th in amount of service, 18th in regularity of service, 14th in breakdown rate, 9th in crowding, 12th in cleanliness and 14th in in-car announcements.
The report also found that Subway regularity decreased since last year’s report. Subway lines meeting the “wait assessment” standard—which measures the regularity versus gaps and/or bunching in service—decreased 1.4 percent, from 78.8 percent regular in our last report, to 77.4 percent regular in the period ending December 2015.
Four lines improved in the wait assessment standard including the F line, which passes through Jamaica, Kew Gardens, Forest Hills and Long Island City. But 16 lines, including the 7, A, E, M, N and R worsened.
NYPIRG has been tracking the state of the 20 subway lines since 1997. The group argues that the report card helps to fulfill the public’s desire for transparency in government and helps groups advocate for better service, providing key statistics to make arguments for more frequent service or better maintenance.
For a full list for the best to worst Subway lines, check out the report card here. You can also view a profile of each Subway line here.