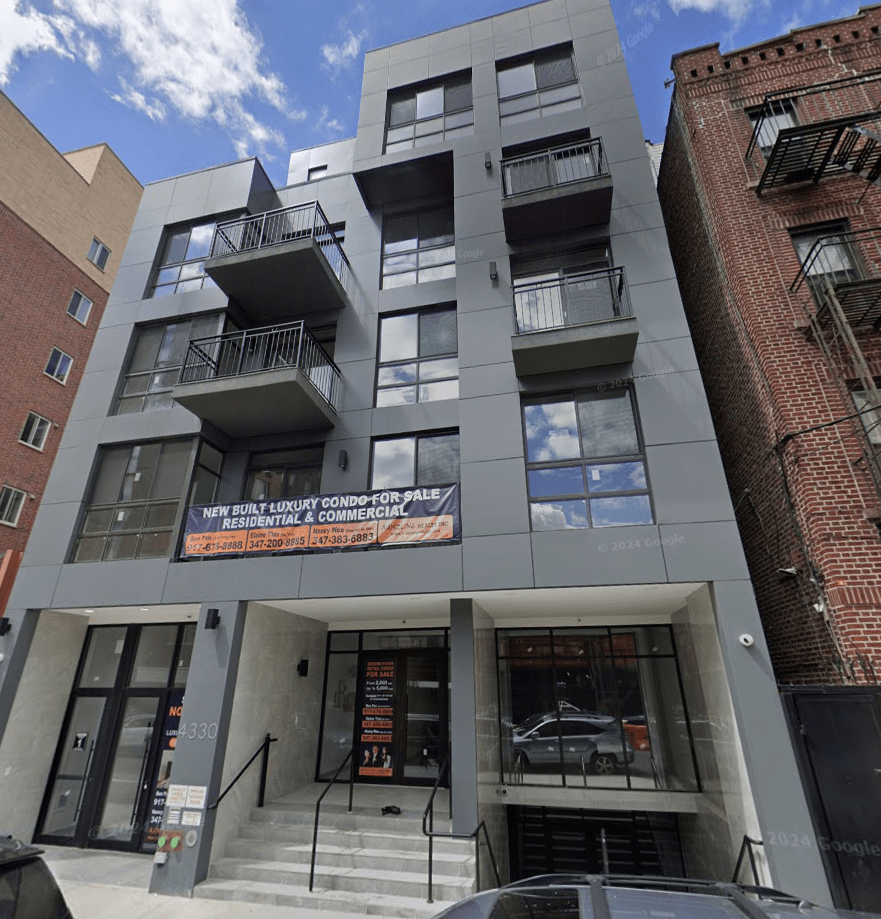
The average cost of rent across New York City reached $3,966 a month by the end of April 2025, amounting to 144% more than the national average of $1,625, according to a report by Apartments.com.
Based on the average rent in New York City, residents would need to be earning $13,206 a month, or $158,472 a year, in order to live comfortably. This type of salary would allow one to devote no more than 30% of their monthly income towards paying the rent.
New York City’s $3,966 average rent represents a 1.9% increase year-over-year from the $3,889 monthly rent entering May 2024. Additionally, the same study found that the average size of an apartment in New York City was 599 square feet at the start of May 2025.
All of the ten most expensive New York City neighborhoods are in the borough of Manhattan. Seven of the ten most expensive neighborhoods also have average apartment sizes higher than the average in New York City.
Lincoln Square was the most expensive neighborhood in New York City, with an average monthly rent of $7,248. West Village was a distant second, at $6,438 a month, followed by the Lower West Side at $6,359, Hell’s Kitchen at $6,314 and Greenwich Village at $6,240. Rounding out the top ten are Chelsea ($6,217), Midtown West ($5,999), Gramercy Park ($5,964), the Upper West Side ($5,925) and Midtown South ($5,891).
In Queens, the most expensive neighborhood is Long Island City, with average rents of $3,605 for studios, $4,131 for one-bedroom units, and $5,868 for two-bedroom apartments. Other neighborhoods experiencing notable rent increases include Astoria, where one-bedroom rents rose from $2,720 in 2024 to $3,041 in 2025, and Rego Park, where two-bedroom rents increased from $3,656 to $4,028 over the same period.
The cost of living in Queens is 45.2% higher than the national average, with housing being 134.6% more expensive. Residents can also expect to pay 11.1% more for groceries, 9.4% more for utilities, and 2.4% more for transportation compared to the national average