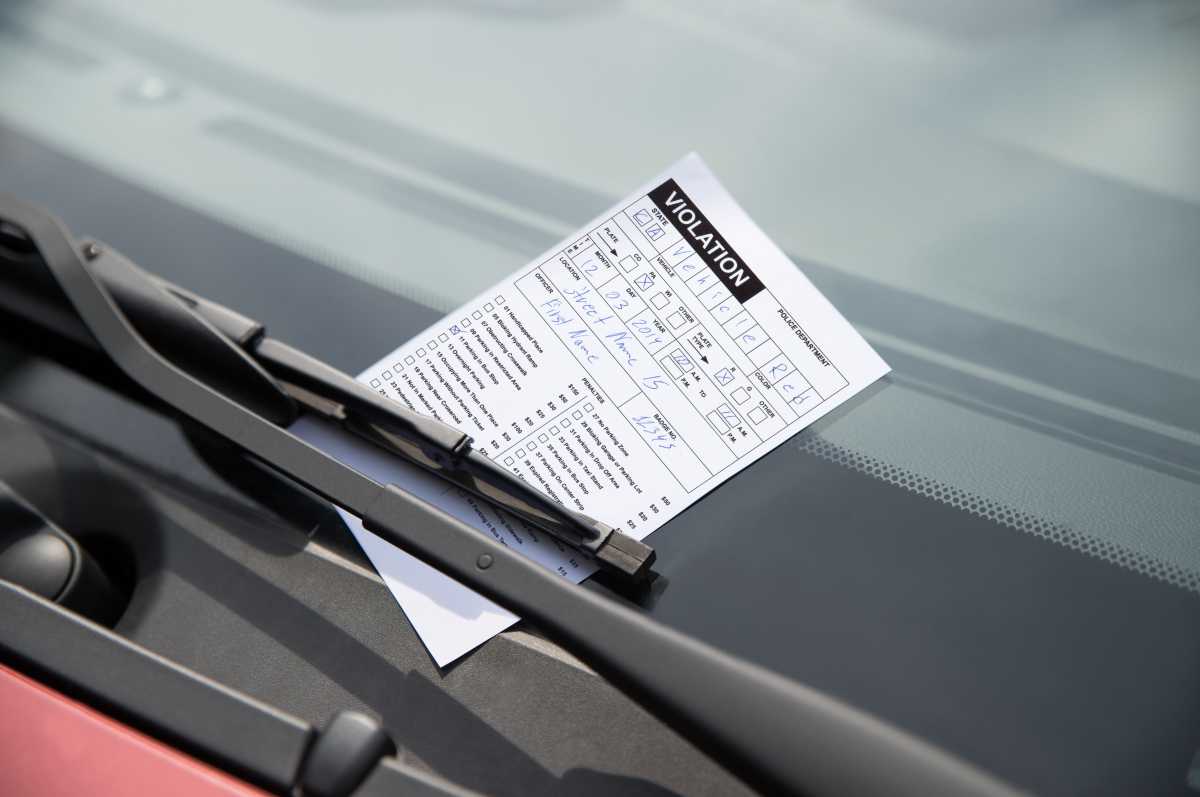
For those who do not have a driveway to park their car in every night, the dreaded orange envelope on the windshield may be a common sight.
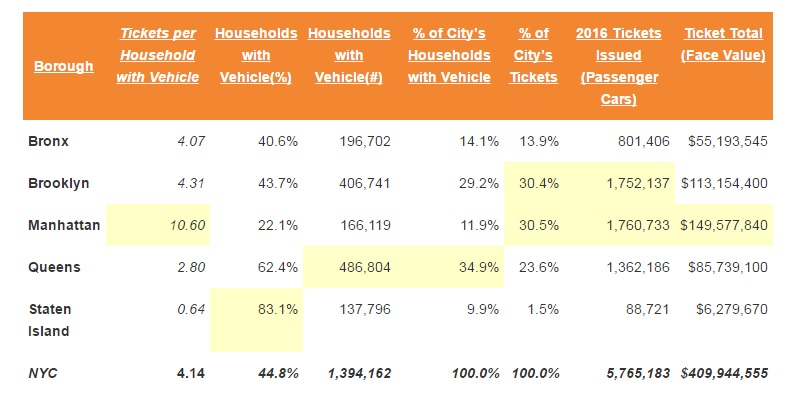
RentHop, a real estate website, broke down by police precinct how many tickets were issued around the city. Compared to other boroughs, Queens has the second largest car ownership rate but overall ranks fourth in amount of tickets issued. About 62.4 percent of households in the borough own a car and they pay about 2.8 tickets a year.
In total, the Department of Finance (DOF) issued 10 million tickets in 2016, which amounts to about $715 million in revenue before late fees. In 2015, 11.7 million tickets were issued at a cost of $846 million.
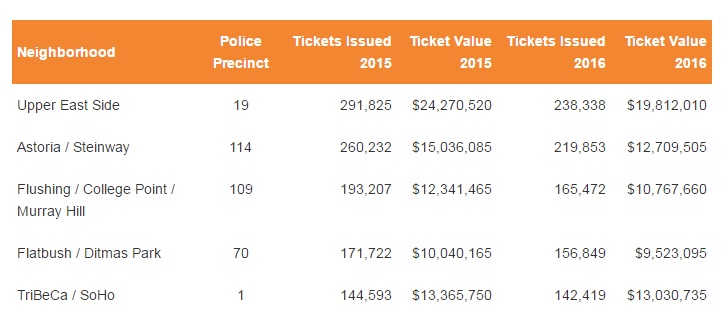
The 114th Precinct, which is based in Astoria, was the second most ticketed area in the five boroughs with 219,853 tickets issued in 2016. Considering the population for that precinct is 202,759, every resident living there could’ve been issued a ticket or two.
That number dropped dramatically compared to 2015, when 260,232 tickets were issued in Astoria.
The 109th Precinct, which includes Flushing, College Point, Murray Hill and Whitestone, saw 165,472 tickets issued for a population of 247,354. This number also dropped from 2015, when 193,207 tickets were issued.
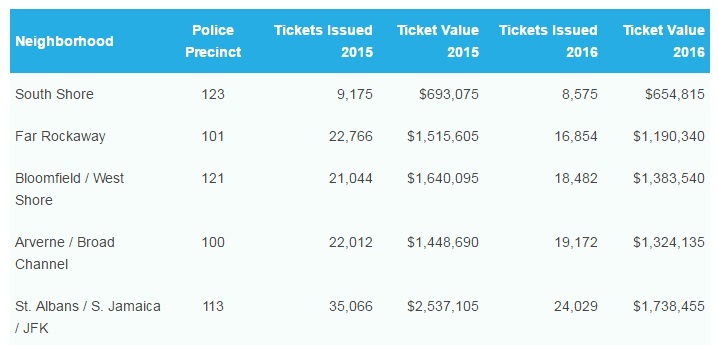
Three neighborhoods in Queens made the least ticketed list including Far Rockaway, Arverne and Broad Channel, which are served by the 100th Precinct and St. Albans and South Jamaica, which are served by the 113th Precinct.
RentHop expects tickets issued to rise in 2017 after Mayor Bill de Blasio announced budget increases to prepare for expected drops in federal funding from the Trump administration and the costs of securing Trump Tower.
The $84.7 billion budget proposal is is $12 billion greater than the city budget in 2014 and former Mayor Michael Bloomberg’s final budget of $72.7 billion.
To find out how many tickets were issued in your neighborhood, view the map on RentHop.

